Viewing your Mailing List Graphs and Statistics
MailList King maintains a variety of statistics and graphs to allow you to measure membership trends and group popularity.
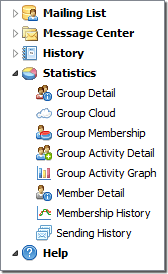
You can display them by selecting the relevant mode under "Statistics" in the main window.

There are eight sections:
Group Detail
Lists
each of your groups with their memberships, send and receive counts and
other details. The "Settings" display
view shows at a glance which groups have custom
messages or sending disabled.
Group Cloud
Visualize your group
membership where text size and color represent the size and status of
each group
Group Membership
A
pie-graph displaying the percentage of members in each of your groups.
Group Activity Detail
Lists
the activity (subscribes, removals and bounces) for your groups over time
Group Activity Graph
A graphical representation
of the above information
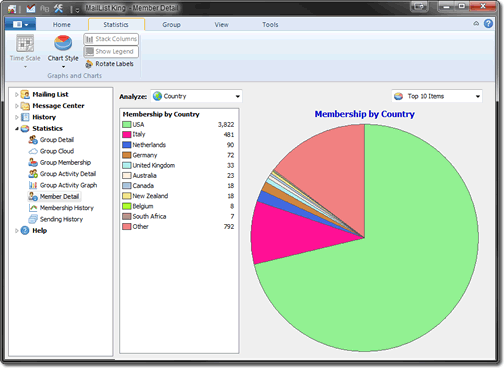
Member Detail
Identify statistical information of your members, e.g. the percentage from each country, state, sex, language, etc.

Membership History
Displays
the number of members in your groups over time
Sending History Detail
Displays the number of
messages sent over time, as well as responses and undeliverable messages
Sending History Graph
Graphical representation of messages sent over time
Click File > Export to save your graphs to image files and your statistics to Excel spreadsheets.
See Also